


+13 years
+125
90%

About the service
In most companies, data is scattered across the ERP system, the CRM, spreadsheets, and analytics tools, yet reports are still put together manually in Excel. Someone pulls extracts from several sources, combines them, checks the figures, and sends them out by email. It is not the analysis that consumes the most time, but the collecting and merging of data itself. Every link in that chain adds the risk of errors and delays, and the numbers in different departments' reports stop matching.
Microsoft Fabric addresses this problem at its root: it brings data integration, the data warehouse, ETL processes, and Power BI reporting together on a single cloud platform. ANEGIS designs and implements Fabric end to end: from the architecture, through the integration of source systems and the build of the warehouse, to reports, automated distribution, and AI. If you are implementing or expanding Dynamics 365, we design the warehouse as early as the ERP analysis phase, so the data layer is created together with your processes rather than as an afterthought. Finally, we hand the knowledge over to your team, so the solution can live and grow without us.
The problem rarely lies in the reports. It lies in what happens before they are created.
These situations come up in almost every organization we talk to about data. If you recognize them in your company, Fabric is an answer worth testing.

Reports finished manually in Excel
Data scattered across systems
Power BI reaching its limits
An aging warehouse or OLAP cubes
Manual report distribution
A platform decision without hard data
What Fabric changes in the daily work of a company
A shorter path from event to decision
Data from source systems reaches the platform in near real time, without periodic exports or overnight batch loads. Executives and managers look at the current picture of the company, not the state from a week ago.
Analysis instead of consolidation
Teams stop pulling and merging data because they receive a ready, consistent model. The time previously consumed by coordinating data collection goes back into substantive work.
A single source of truth
Shared dictionaries of customers, products, and periods, together with central semantic models, mean that sales, finance, and controlling look at the same numbers. Disputes over whose report is correct come to an end.
Monitoring instead of a monthly report
Where timing matters, the platform watches thresholds itself and notifies the owners of each topic: an exceeded credit limit, expired collateral, a drop in margin. You react when the problem arises, not when it surfaces in a report after period close.
Auditability and access control
A complete history of changes to data and logic, permissions granted by role, and data visibility restricted to a region or department. Sensitive data is visible only to those authorized, and you can demonstrate who changed what, and when.
Infrastructure costs under control
We size compute based on measurements, not estimates. Automatic pausing outside working hours cuts cloud costs by 50 to 60 percent compared with continuous operation, and an annual reservation saves a further 40 percent or so once the workload is stable.
We'll help you with your transformation
Who gets the most out of Fabric
There are many different starting points for Fabric. Most often we work with six types of organizations.
BI and analytics teams
You use Power BI, SQL Server, or an on-premises warehouse, but the current architecture is no longer scaling. Fabric looks like the natural next step; what is missing is a clear implementation scenario and a realistic view of how much work it will actually save.
Organizations with an on-premises data warehouse
SQL Server or Oracle, data scattered across systems, growing infrastructure maintenance costs. Cloud migration looks complicated, so the decision keeps being postponed. We start with a single business area, with no big-bang migration up front. If your warehouse is SAP BW, see our separate page on SAP data in Fabric.
Companies making heavy use of Power BI
Dozens of reports, multiple sources, no shared data model or governance. The reports work, but they are expensive to maintain, and the numbers drift apart between them. Fabric brings order to the data layer beneath the reporting your team already uses.
Organizations implementing or expanding an ERP system
Finance, controlling, and IT need management reporting that standard ERP reports will not provide, and building a full warehouse looks like a separate, major project. With us it is not a separate project: we design the data layer in parallel with the Dynamics 365 implementation.
IT and data leaders facing a decision
You are responsible for the architecture and the budget, so you need specifics: costs, limitations, security requirements, and a plan for the next steps. We deliver them as measurements and documentation, not promises.
Companies comparing data platforms
You are considering Fabric, Azure Synapse, Snowflake, or Databricks and do not want to invest in the unknown. A controlled PoC shows Fabric's real strengths and weaknesses on your own case, and we say openly when another platform is the better choice.
The fastest first step
A controlled proof of concept that shows within a few weeks how Fabric performs on your data, what benefits it delivers, and what a production implementation will cost. No licensing risk, no leap in the dark, no obligations once it ends.
Parameters
- Duration: 4 to 6 weeks
- Effort: 20 to 30 working days
- Billing: fixed price, known from the start
- Environment: free Microsoft Fabric trial, with no license costs on your side
Scope
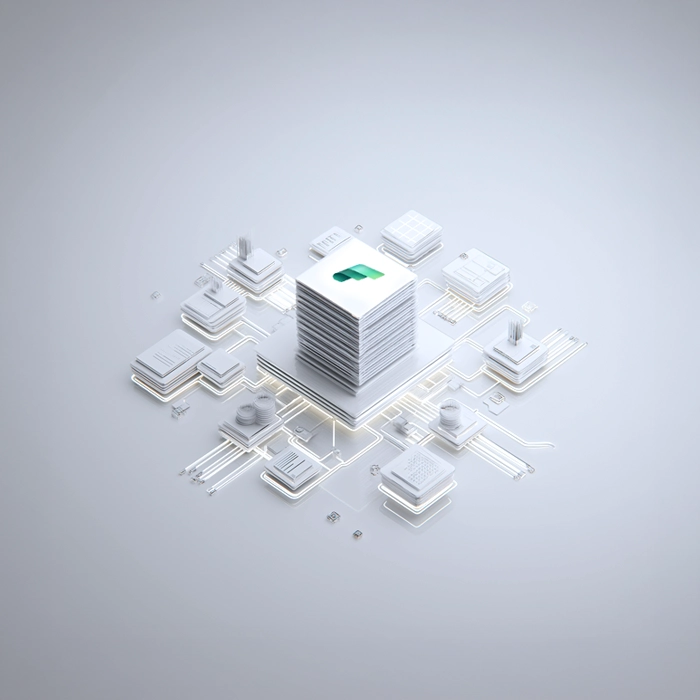
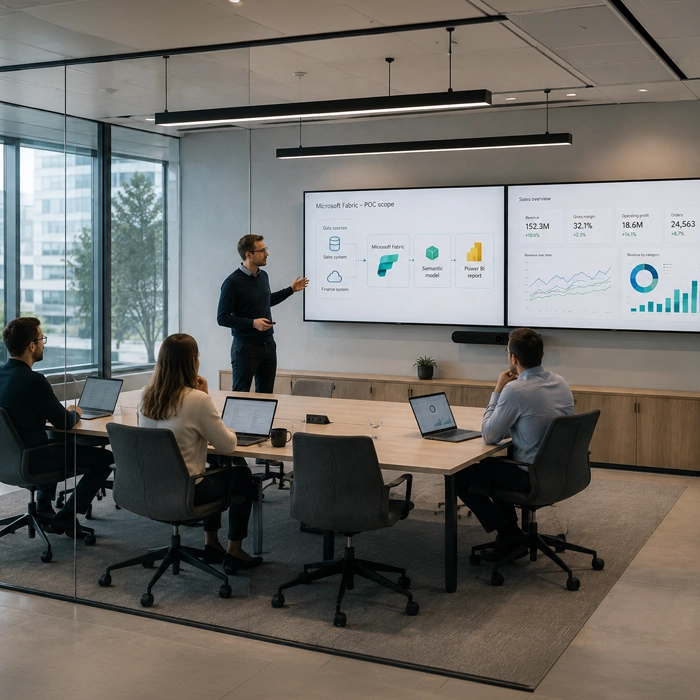
Within the PoC we cover one business area, for example sales, finance, or production, one Power BI report of medium complexity, and up to two data sources. We go through the full process in Fabric: source integration, data transformation, the semantic model, and the report. The scope is agreed together before the start, which makes the project predictable and lets you compare the PoC results fairly against competing platforms.

How the PoC runs
- Kick-off workshop. Together we define the business objectives, the available data, and the key indicators the report should address.
- Architecture design. We design a solution in Fabric tailored to the selected business case.
- Implementation. We build the complete data flow and the Power BI report within the agreed scope.
- Demo. We present the working Fabric components and the report on your data.
- User testing. Your team reviews the solution and we apply corrections.
- Knowledge transfer. Summary workshops for your team.
- Development recommendation. A diagram of the target architecture and concrete next steps.
- Cost estimate. A licensing proposal and ways to keep infrastructure costs down.
What you receive at the end
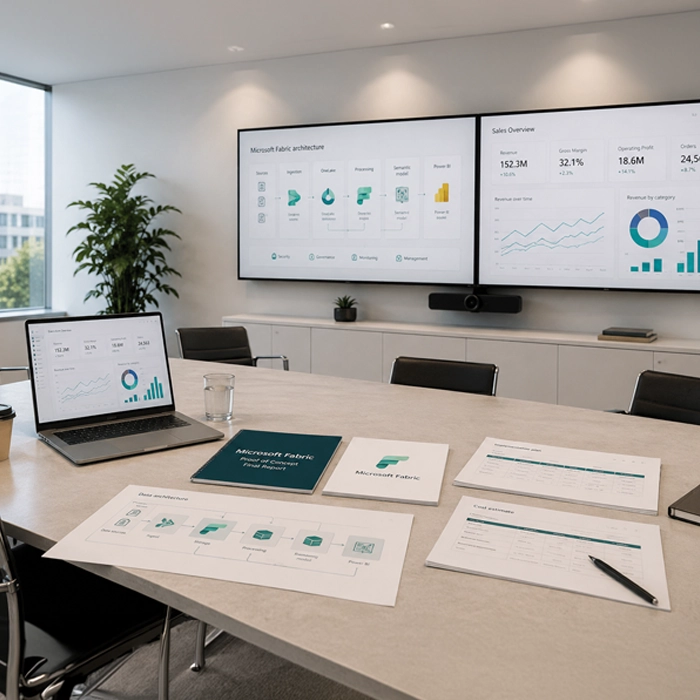
A working Power BI report on your own data, a configured Fabric environment, an architecture diagram, a cost estimate, a plan for further implementation, and workshops for your team. It is not a demo or a slide deck, but the foundation of the next project. And if the PoC shows that Fabric is not for you, you walk away with a clear “no” and no obligations.
Let's talk about a PoC



The foundation of the analytics platform
A central data warehouse is the heart of every Fabric implementation. We design it according to the proven medallion architecture pattern, which ensures data quality, auditability, and reporting performance.

A three-layer architecture
Data passes through three processing layers. The bronze layer stores data in its raw form, faithful to the source, which allows for reprocessing history when business logic changes without needing to go back to the source systems. The silver layer cleanses the data, removes duplicates, standardizes data types, and performs initial joins. The gold layer holds data aggregated for reporting, including key indicators and measures, ready for fast querying by BI tools.

A data model that understands your business
In the gold layer, we build a star-schema model: shared dimensions such as calendar, product, customer, supplier, chart of accounts, and cost centers, alongside fact tables for sales, inventory, purchasing, logistics, receivables, payables, and the general ledger. The same dictionaries serve all processes, ensuring that reports from different departments always speak the same language. We base the model structure on an analysis of your current reports and cubes, so the new warehouse answers the questions the business is already asking from day one.

Dynamics 365 integration without loading the system
If your system is Dynamics 365 Finance and Operations, we bring the data in through the native Fabric Link mechanism. It reaches the platform in near real time, and thanks to OneLake shortcuts it is not physically copied, so the integration does not burden the ERP system with additional transactions. Importantly, in Dynamics 365 implementations we design the warehouse in parallel with the ERP analysis and align its build schedule with the milestones of the implementation project. We model the ERP processes from the start so that the data they produce lends itself to meaningful reporting.

Data access points
Business users work with Power BI reports built on semantic models. Analysts and external systems, including Excel, can query the gold layer directly through the SQL analytics endpoint, like a regular database.

What you receive beyond the warehouse itself
A data catalog describing dimensions, facts, and relationships, complete implementation documentation, naming conventions, and a description of roles, responsibilities, and security procedures. These are the documents that keep the solution maintainable and extensible for years, with or without us.
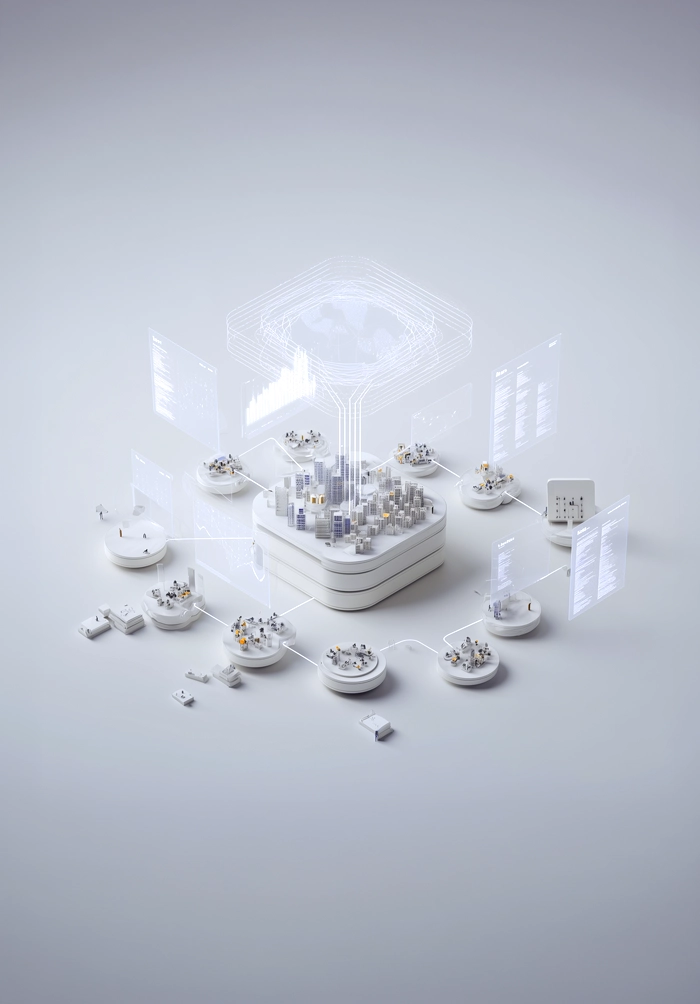
All systems in one place
The real value of a data platform begins where a single system ends. In Fabric we combine data from ERP and CRM systems, data warehouses, analytics tools, and ordinary spreadsheets.
- Systems we have integrated in our projects: Dynamics 365 Finance and Operations, SAP, Salesforce, Snowflake, Enova 365, Google Analytics, industry-specific systems, and Excel files with planning data and dictionaries. Where a client already has working integration processes, for example Python scripts, we build on them instead of starting everything from scratch.
- How we do it technically. Depending on the source, we use Fabric's native mechanisms: Fabric Link for Dynamics 365, mirroring and OneLake shortcuts, data pipelines for orchestration, and Spark jobs for transformation. Data from all sources lands in a single OneLake repository and passes through the same quality layers.
- User spreadsheets have their place too. In almost every company, part of the data lives in Excel: dictionaries, mappings, plans, limits. Rather than fighting them, we bring them onto the platform in a controlled way. The files stay on SharePoint, where access is governed by its permissions, and the platform automatically picks up the current version. Users keep editing a familiar spreadsheet, and their changes flow into the reports without manual copying.
- A principle that protects your budget. Fabric is for integrating analytical data, not for relocating operational logic. Calculations that belong in the source system, such as live price calculation, stay in the source system. We know from project experience that moving operational logic into the analytics layer is labor-intensive and costly, which is why we guard this boundary from the first workshop.
One process to begin with
You do not have to start by building the entire platform. Sometimes the best first step is automating the one report that costs the most manual work today.
How it works in practice
We pick one recurring report that is currently produced by manually stitching together data from several sources: credit limit utilization, receivables aging, the daily sales report. We connect the sources to Fabric, recreate the report's logic in a semantic model, and publish it in Power BI. The report refreshes itself, and the process stops depending on the availability of one person and their spreadsheet.
An example from our projects
For a company in the energy sector, we automated a credit limit utilization report that had previously been produced by manually combining data from the ERP system, the CRM system, and several spreadsheets. The new solution aggregates receivables, limits, and collateral at the customer level on its own, maintains a full history of changes, and notifies account managers when limits are exceeded. The team's work shifted from coordinating data collection to analyzing risk.
Why it is a good start
The scope is small and measurable, the effect is visible within weeks, and the foundations built along the way, that is the environment, the integrations, and the first models, become the first building block of the target analytics platform. You add subsequent processes onto a ready architecture at an ever lower cost.
From data to decisions
The reporting layer is where the platform meets people's daily work. We make sure that meeting is frictionless: familiar reports, consistent numbers, and distribution that happens by itself.

- Semantic models as the source of truth. A semantic model defines table relationships, hierarchies, and measures in one place, shared by all reports. A change to the definition of margin or customer segmentation is made once, centrally, and applies everywhere immediately. We also control who can build their own reports on the model and who only uses the ready ones, so user self-service does not erode data consistency.
- Report redesign without a revolution for users. We move existing reports onto the new architecture while preserving the scope of information people are used to, improving readability and ease of use along the way. Users get the report they know, only faster, consistent with the rest of the organization, and cheaper to maintain.
- Distribution that happens by itself. We replace manual sending of extracts with automation in Power Automate. Reports reach recipients on schedule, as a link or a file. Recipient lists are pulled dynamically from the company directory, SharePoint lists, or Dataverse, so a staffing change does not break the distribution. Content and filters adapt to the recipient: a salesperson receives their own results, a regional director their region. Every delivery is logged, so you know what went to whom, and when. It is a modern successor to legacy report broadcasting tools, without their limitations in versioning and control.
Answers instead of a queue to the analyst
Data Agent lets users ask questions about data in plain language, for example in Microsoft Teams, and receive answers as numbers, tables, or charts. No query writing, and no waiting for someone on the BI team to find time.
- How it works. The user's question goes to the agent, which knows the structure of your data and the sample queries we have prepared. On that basis it generates a DAX or SQL query, runs it against the model, and returns a formatted result. The user asks “what were last week's sales in the southern region”, not “write me a query”.
- Security built in, not bolted on. The agent operates in the context of the identity of the person asking and inherits their permissions: it sees only the data, workspaces, and reports that user has access to, including row-level restrictions. It is therefore not a side channel around the permission system. Data does not leave your organization.
- What we configure as part of the implementation. We prepare instructions describing the data structure, a set of sample queries matched to your most common business questions, and the integration with your chosen interface. The better the agent knows the context, the more accurate its answers, which is why this is a project deliverable, not a switch to flip.
Data that drives decisions
Start with a free consultation or a POC that will demonstrate Fabric using your own data in just a few weeks.
You pay for what you use
Fabric's licensing model is often the first hurdle in implementation discussions. We know it well and design solutions so that you do not overpay, either at the start or in ongoing operation.
Sizing based on measurements, not guesswork
Billing is based on Fabric Capacity compute, available in plans from F2 upward. Instead of guessing how much capacity will be needed, we run development work on the free sixty-day trial, which provides capacity equivalent to the high-end F64 plan. During that time we measure the actual resource consumption of the processes, and only then do we recommend the target plan, most often in the F4 to F16 range. You start paying for infrastructure only once it is known how much of it you really need.
Two purchasing models, chosen deliberately
Pay-as-you-go, billed per second of operation, is what we recommend at the start: it lets you scale capacity at any time and stop the environment when it is not working. An annual reservation lowers the cost of capacity by around 40 percent and makes sense once the workload is stable and predictable. We help you pick the right moment to switch from one model to the other.
Pausing that genuinely lowers the bill
We implement automatic management of environment availability: the platform starts before the morning data refresh and stops after working hours and for the weekend. In a typical scenario this means costs 50 to 60 percent lower than continuous operation. If some reports must be available at all times, we design a separate capacity for them that runs independently of the paused one.
Separate environments without doubling the cost
We split the total capacity into two smaller environments: production for users and development for ongoing work. The combined cost stays similar, and heavy development work does not slow down the reports the business relies on.
User licensing without surprises
In plans below F64, access to reports requires named Power BI Pro licenses, and once a data model exceeds 1 GB, Premium Per User licenses. We say this openly at the estimation stage, so the total cost of the solution does not surprise you after go-live.
Microsoft funding
For qualifying projects, we help secure implementation funding from Microsoft partner programs, which directly lowers the cost of the work.
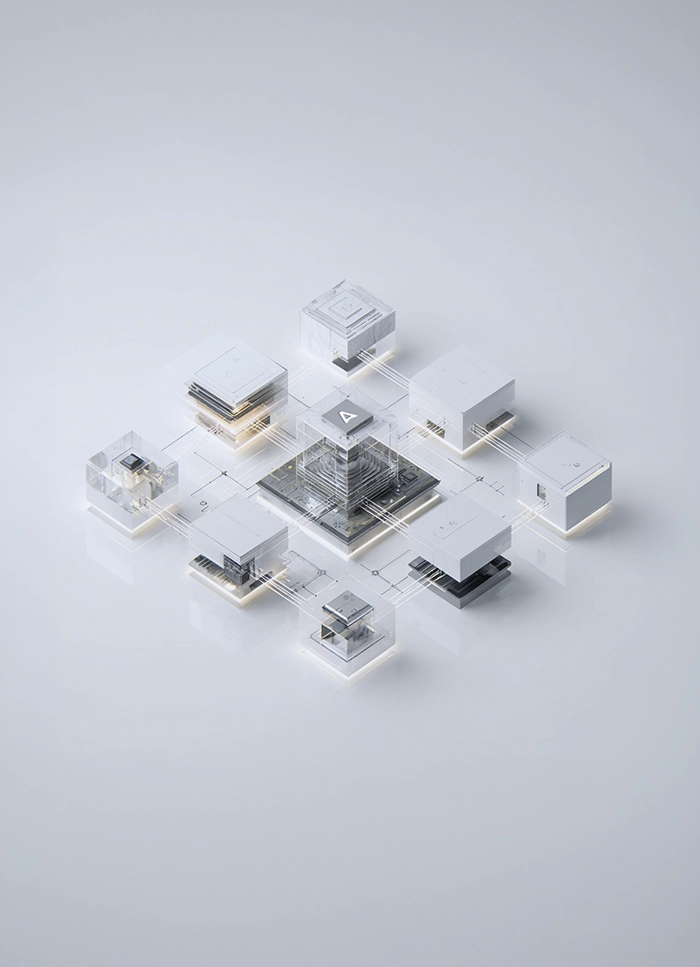
A platform your IT department can sign off on with confidence
An analytics solution at company scale must meet the same standards as any other critical system: version control, separated environments, auditable access. We build this in from day one, not after the first incident.
- Working with the solution as code. Every element of the platform, from a data pipeline to a semantic model, is stored as code in a Git repository in Azure DevOps. Developers work on separate branches, in private workspaces, fully isolated from one another and from production. Changes reach the main branch only after review, which provides a history of every modification and a safe way to roll back.
- Deployments without human error. Moving changes between the test and production environments is handled by Fabric deployment pipelines. Before publishing, the mechanism compares the contents of both environments and highlights the differences, while configuration parameters are substituted automatically. Reports in production always come from tested code, and the production environment is read-only for the development team.
- Permissions you can audit. Access is granted exclusively through Entra ID groups, never individually, following the principle of least privilege: administrators, creators, consumers. Data that requires segmentation is protected with row-level security, so each user sees only their own region or department. Platform administration roles and Azure resource management roles are kept separate, and the lists of authorized users are reviewed regularly. The result: at any moment you can demonstrate who has access to what, and why.
The solution stays with you. So does the knowledge.
The measure of a successful implementation is not the go-live date, but whether six months later your team is developing the platform on its own. That is why we build knowledge transfer into the project from the first week.
.svg)
Knowledge shared continuously, not at the end
Your team takes part in the key project decisions on architecture, the data model, and report scope. We share knowledge about the platform and the adopted standards as we go: during project meetings, working consultations, and joint validation of results. Nobody receives a finished package to unwrap.

A closing training session for key users
At the end we bring everything together in a training session covering the solution architecture, working with the Fabric components used in the project, and using the models and reports. The team leaves prepared for independent work, not just for clicking through ready-made reports.

Hypercare after go-live
In the first period after launch we provide a support package, typically 40 hours in the first month: stabilizing the solution, answering users' questions, applying minor corrections. The transition from project to daily operations happens without disruption, and questions get answers right away.

Why we work this way
Most organizations already have people who can build reports, in controlling, finance, or IT. Our role is to give them an organized, high-performing data layer and confidence in navigating the platform. We consider making a client dependent on their vendor a bad practice.


.svg)

Why entrust your Fabric implementation to us

ERP and data in one team
Alongside our data team, nearly a hundred Dynamics 365 specialists work at ANEGIS. In ERP projects we design the warehouse as early as the analysis phase, together with process modeling, so the data is fit for reporting from the outset. A vendor focused solely on analytics does not sit inside the implementation project and cannot replicate this advantage.

Experience from real migrations
We have moved reporting off SAP BW warehouses, off OLAP cubes and SSRS reports from older Dynamics versions, and out of environments combining Snowflake, Salesforce, and industry systems. We have built reporting architectures serving more than a hundred financial reports for dozens of concurrent users. We know not only the technology but also the pitfalls of these projects.

A fixed price with a safety cap
We quote work on a fixed-price basis, and our contracts state that any overrun will not exceed 10 percent of the value. You know the cost from the start, and you are not funding our learning curve.

Cost optimization as standard
We size compute based on trial-period measurements, implement automatic pausing, and advise on the right moment to switch to a reservation. We design so that the cloud bill is an argument for the platform, not against it.
.svg)
Microsoft Solutions Partner
We hold Microsoft's highest partner status, and with it access to the vendor's technical resources and to the funding programs our clients benefit from.

Honest platform advice
We know Snowflake and Databricks and can tell you when they are the better choice. A PoC ends with a clear “yes” or “no”, not a sales presentation.

The knowledge stays with you
Documentation, a data catalog, training, and hypercare are fixed elements of every implementation. Your team takes over the solution consciously and develops it independently.

See how we transform tech companies
BBK


BUUK Infrastructure


Eton Shirts


CTDI


Exterion Media


Georg UTZ


WPP


Westfield


TERG


S&P Polska


Saller Polbau


OSTP


Nicols


New Yorker


NCC


Global Advertising Holding

Cooperation models
- Fixed-price PoC: a start within weeks and a clear decision at the end.
- Phased implementation: value delivered in waves, from the foundation to subsequent areas, with a schedule aligned with the ERP project where needed.
- Automation of a single process: the smallest entry point with a fast result.
- Post-implementation development and support: hypercare hour packages and further development billed on a time-and-materials basis.





Data that drives decisions
Start with a free consultation or a POC that will demonstrate Fabric using your own data in just a few weeks.
See other services

Dynamics 365 implementation
We will take your company through the whole Dynamics 365 implementation process, from needs analysis, through configuration, to go-live and post-go-live support.

Dynamics 365 integrations and data
Integrate Dynamics 365 with the rest of your company's applications, so data flows smoothly and supports decisions across the whole organisation.

Licensing optimisation
We analyse your Dynamics 365 licences and choose the optimal model, to reduce costs without losing the functions you need.
Frequently asked questions about Microsoft Fabric implementation
How much does Microsoft Fabric cost?
The cost consists of compute capacity, user licenses, and data storage. You buy capacity in plans from F2 upward, either pay-as-you-go or as an annual reservation around 40 percent cheaper. We select the right plan based on measurements from the free trial period, and automatic pausing outside working hours cuts costs by as much as 50 to 60 percent. Instead of estimates, you receive a calculation based on actual consumption.
How is Fabric different from Power BI?
Power BI is part of Fabric and remains the reporting layer your team knows. The difference is that data integration and transformation move out of the reports and onto the platform. Reports become faster and cheaper to maintain, and the same prepared data serves all reports at once instead of being reworked in each one separately.
Fabric, Snowflake, or Databricks?
It depends on your situation. Databricks is strong in advanced data engineering at very large scale, while Snowflake works well in multi-cloud environments and where the team has strong SQL skills and a proven warehouse in place. If your company operates in the Microsoft ecosystem and reports in Power BI, Fabric is usually the natural choice: one platform, one bill, and no cost of integrating separate tools. The shortest route to an answer is a PoC on your data.
Do we have to migrate everything at once?
No. We start with a single business area or a single process and expand the platform in stages. Existing solutions keep running in parallel until the new ones fully replace them, so reporting continuity is maintained throughout the project.
Will Fabric put additional load on our ERP system?
No. We bring Dynamics 365 data in through the native Fabric Link mechanism, and thanks to shortcuts the data is not physically copied with every query. The ERP system experiences no additional transactional load, and the data on the platform stays current in near real time.
Is AI on our data safe?
Data Agent operates in the context of the user's identity and inherits their permissions, including row-level visibility restrictions. It answers solely on the basis of data the person asking already has access to, and the data does not leave your organization.
Will our team be able to maintain the platform on its own?
Yes, and that is the goal. We share knowledge throughout the project, consolidate it with training for key users and complete documentation, and after go-live we provide a support package for the stabilization period. We design the solution so that its further development does not require our permanent presence.

Looking for a Microsoft partner? Let's talk about your project
Work with a team that has delivered implementations and projects for dozens of companies. Schedule an introductory call and see:
How to tailor Dynamics 365 to your company's processes, rather than the other way around
Which areas are worth automating to save time and reduce costs
Here is the step-by-step implementation process with Anegis: from analysis to post-launch support
